


I always thought a bar graph would be a nice addition when viewing only one data parameter. For example, I have been in a few diesel trucks with Edge tuning and the controller uses bargraphs with some of the readouts, and allows the user to set the limits of it. For example i find it really useful for the pyro reading. It makes it easy to judge at a quick glance whats going on, and where its at. Just thought it might be a nice addition.
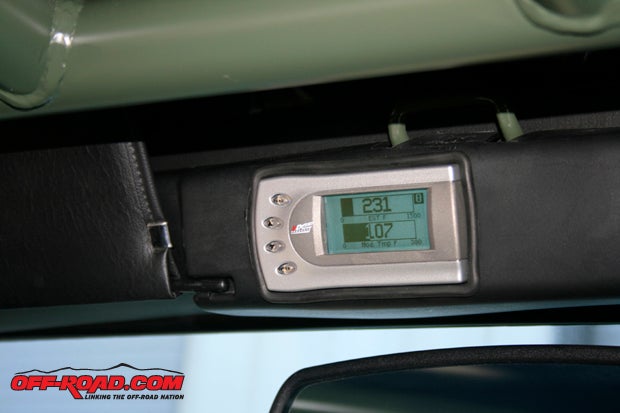
This is what i was trying to describe (not sure if the cluster screen has the resolution for something like this):

 Reply With Quote


Bookmarks